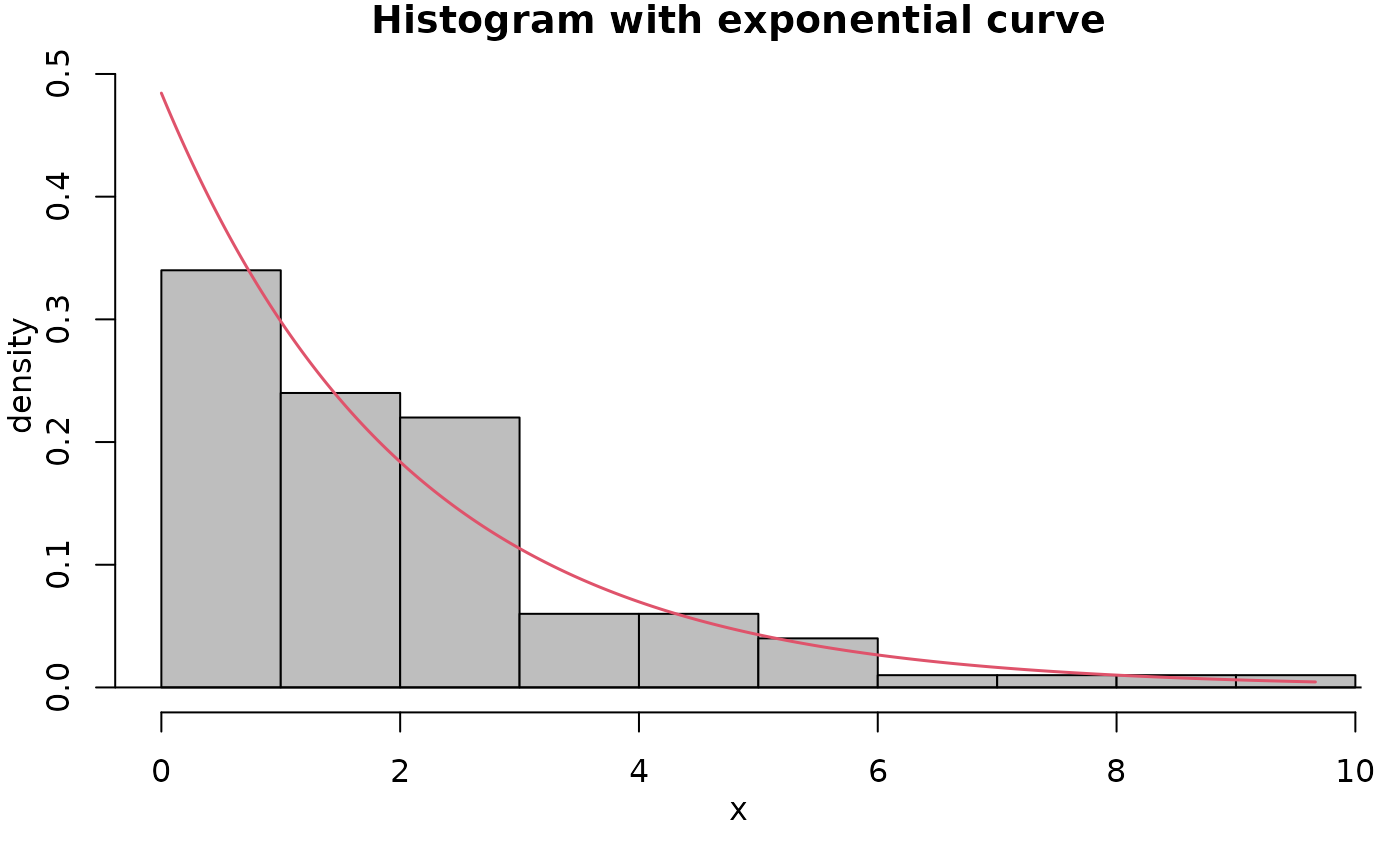
addexp creates a histogram of x and overlays an exponential density
function with \(\lambda = \frac{1}{mean}\).
Usage
iscamaddexp(
x,
main = "Histogram with exponential curve",
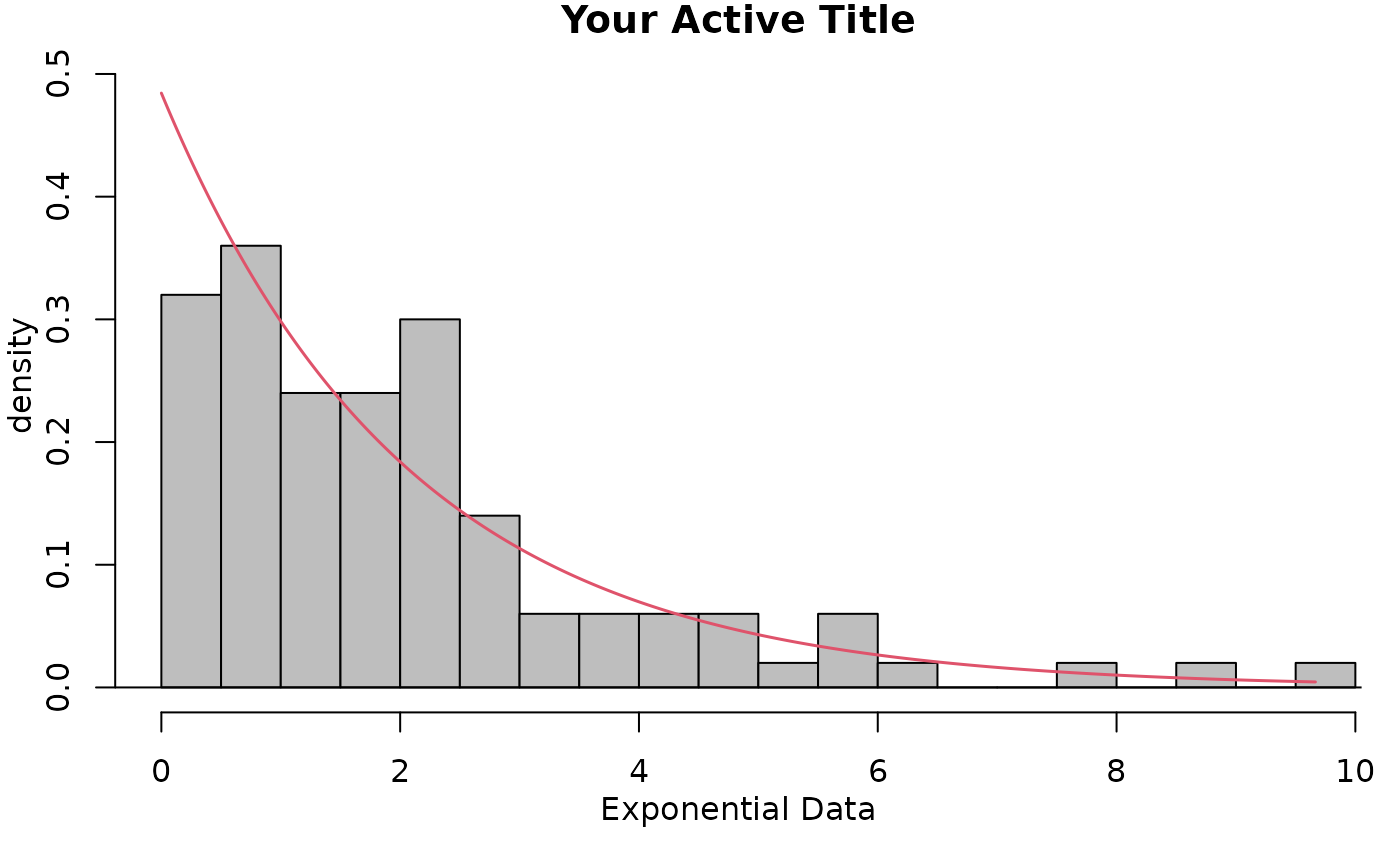
xlab = deparse(substitute(x)),
bins = NULL
)addexp creates a histogram of x and overlays an exponential density
function with \(\lambda = \frac{1}{mean}\).
iscamaddexp(
x,
main = "Histogram with exponential curve",
xlab = deparse(substitute(x)),
bins = NULL
)