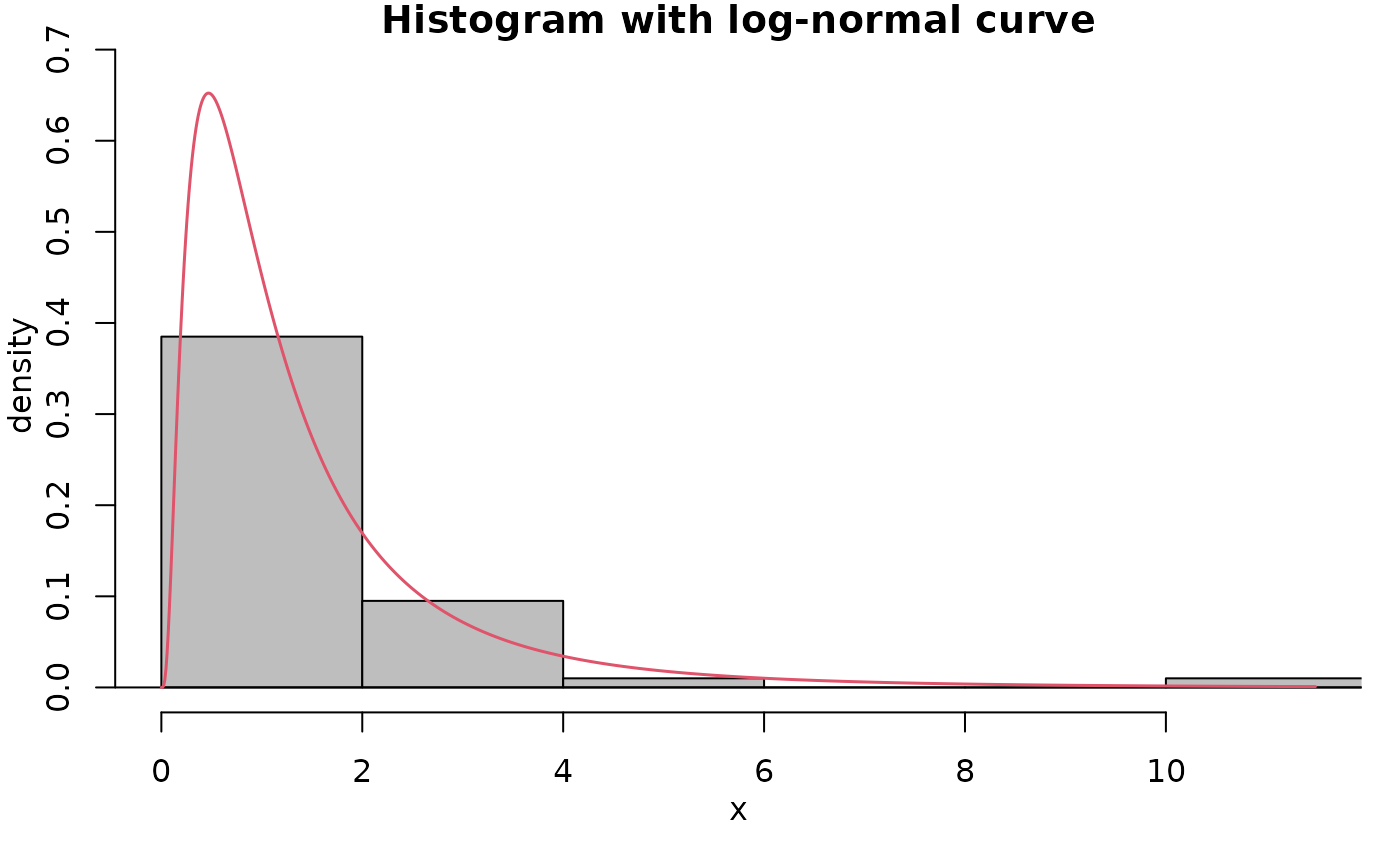
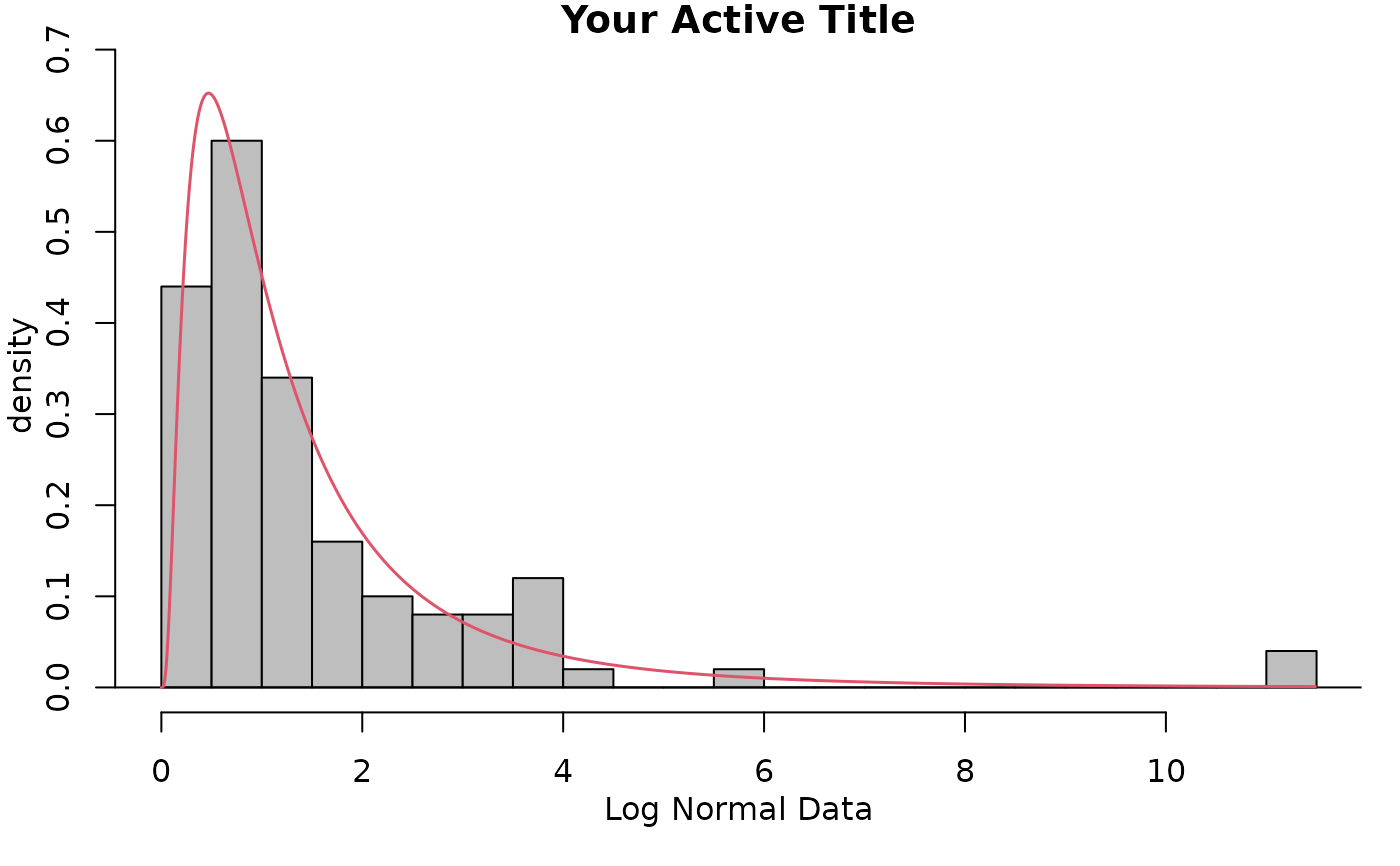
addlnorm creates a histogram of x and overlays a log normal density function.
Usage
iscamaddlnorm(
  x,
  main = "Histogram with log-normal curve",
  xlab = deparse(substitute(x)),
  bins = NULL
)addlnorm creates a histogram of x and overlays a log normal density function.
iscamaddlnorm(
x,
main = "Histogram with log-normal curve",
xlab = deparse(substitute(x)),
bins = NULL
)