Skip to contents

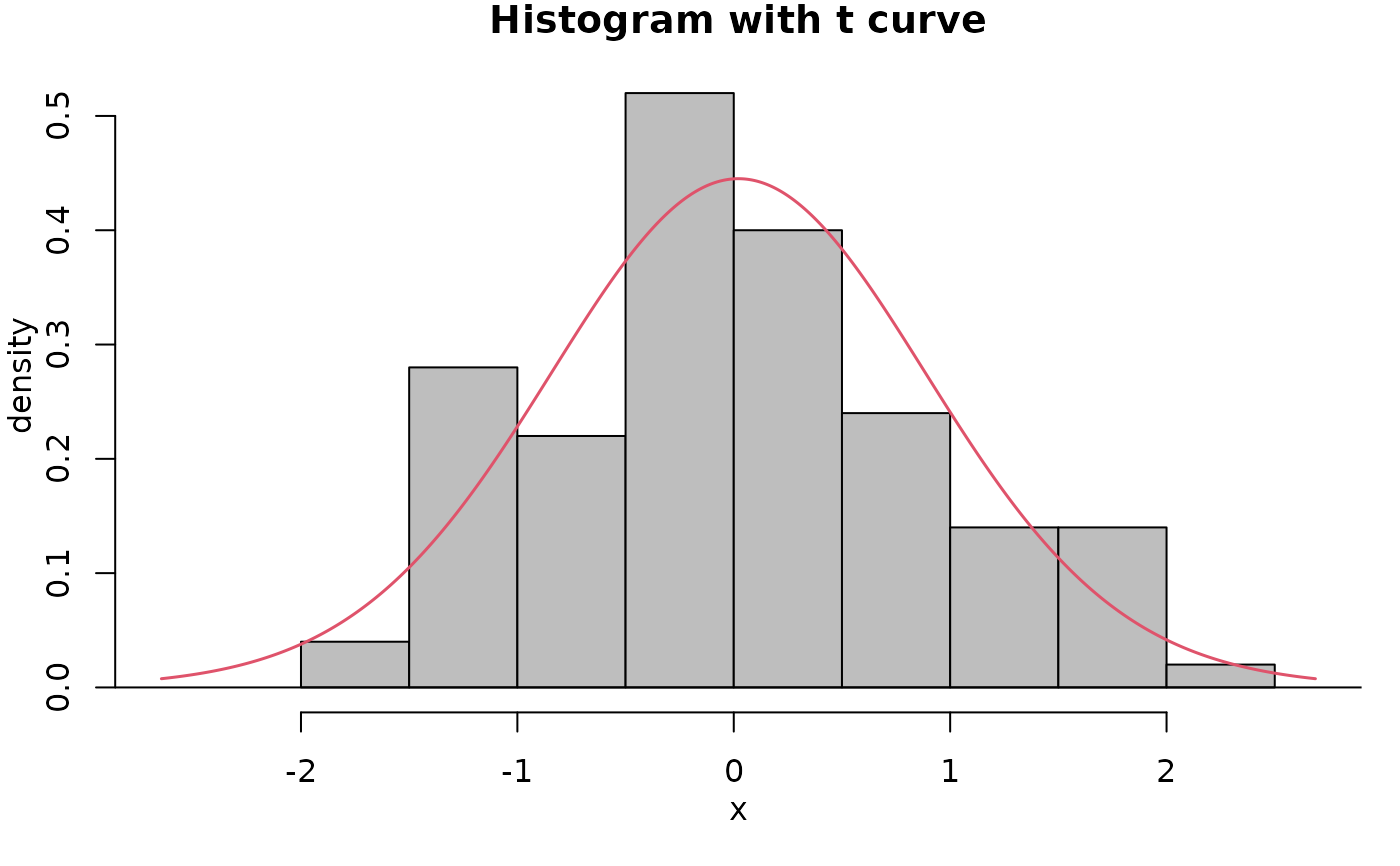
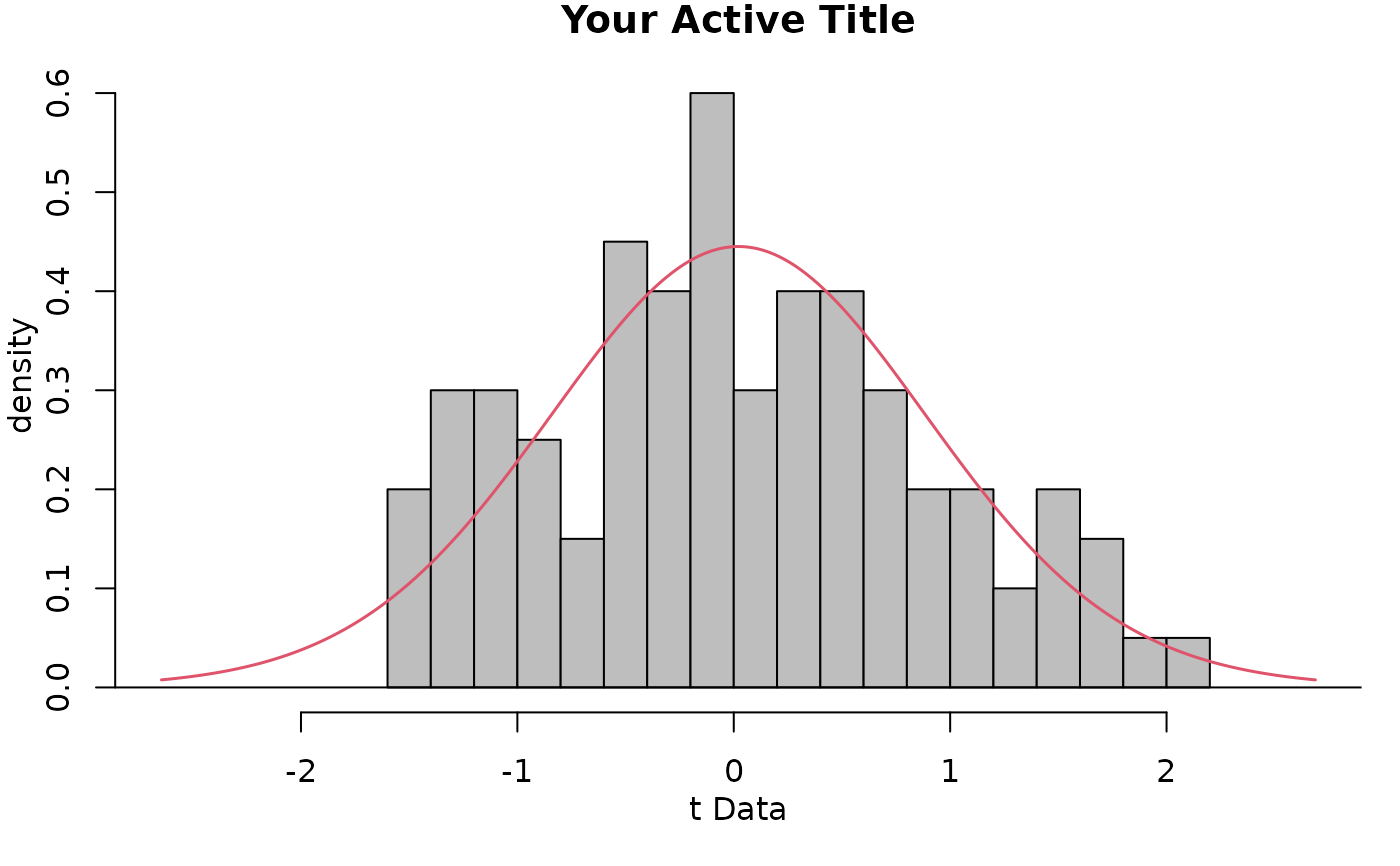
Overlay a t Density Function on Histogram

Usage

iscamaddt(
  x,
  df,
  main = "Histogram with t curve",
  xlab = deparse(substitute(x)),
  bins = NULL
)

Arguments

x

A numeric vector representing the data to be plotted.

df

A numeric value representing the degrees of freedom of x.

main

(optional) title for the plot.

xlab

(optional) x-axis label for the plot.

bins

(optional) number of bins for the histogram.

Value

A histogram of x overlayed with an t density function.

Examples

set.seed(0)
x <- rt(100, 30)
iscamaddt(x, 30)

iscamaddt(x, 30, main = "Your Active Title", xlab = "t Data", bins = 20)