binompower determines the rejection region corresponding to the level of
significance and the first probability and shows the binomial distribution
shading its corresponding region.
Arguments
- LOS
A numeric value representing the level of significance
- n
A numeric value representing the sample size
- prob1
A numeric value representing the first probability
- alternative
"less", "greater", or "two.sided"
- prob2
A numeric value representing the second probability
- verbose
Logical, defaults to
TRUE. Set toFALSEto suppress messages
Examples
iscambinompower(LOS = 0.05, n = 20, prob1 = 0.5, alternative = "less")
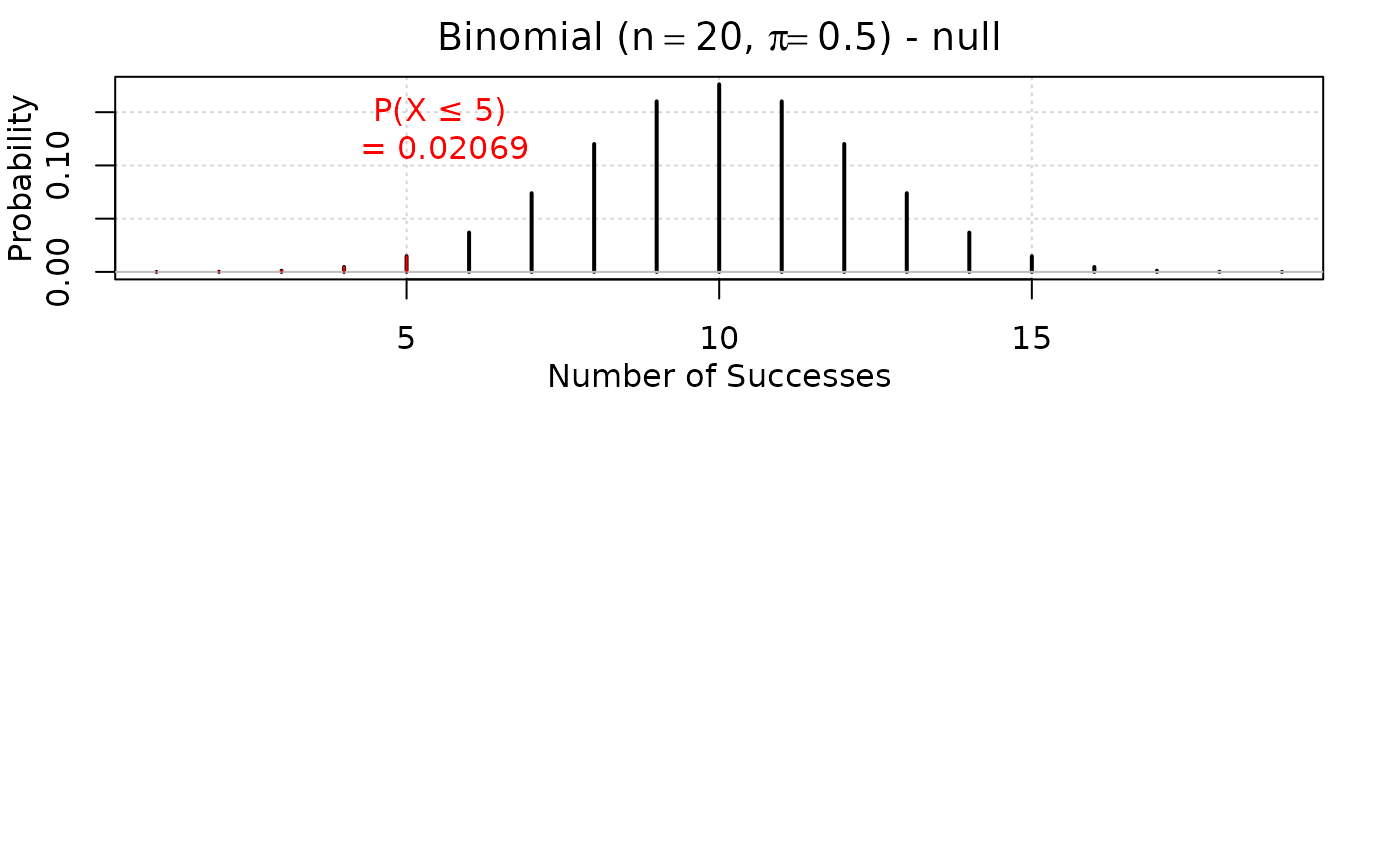 #> Null: Probability 5 and below = 0.02069473
iscambinompower(LOS = 0.05, n = 20, prob1 = 0.5, alternative = "greater", prob2 = 0.75)
#> Null: Probability 15 and above = 0.02069473
#> Null: Probability 5 and below = 0.02069473
iscambinompower(LOS = 0.05, n = 20, prob1 = 0.5, alternative = "greater", prob2 = 0.75)
#> Null: Probability 15 and above = 0.02069473
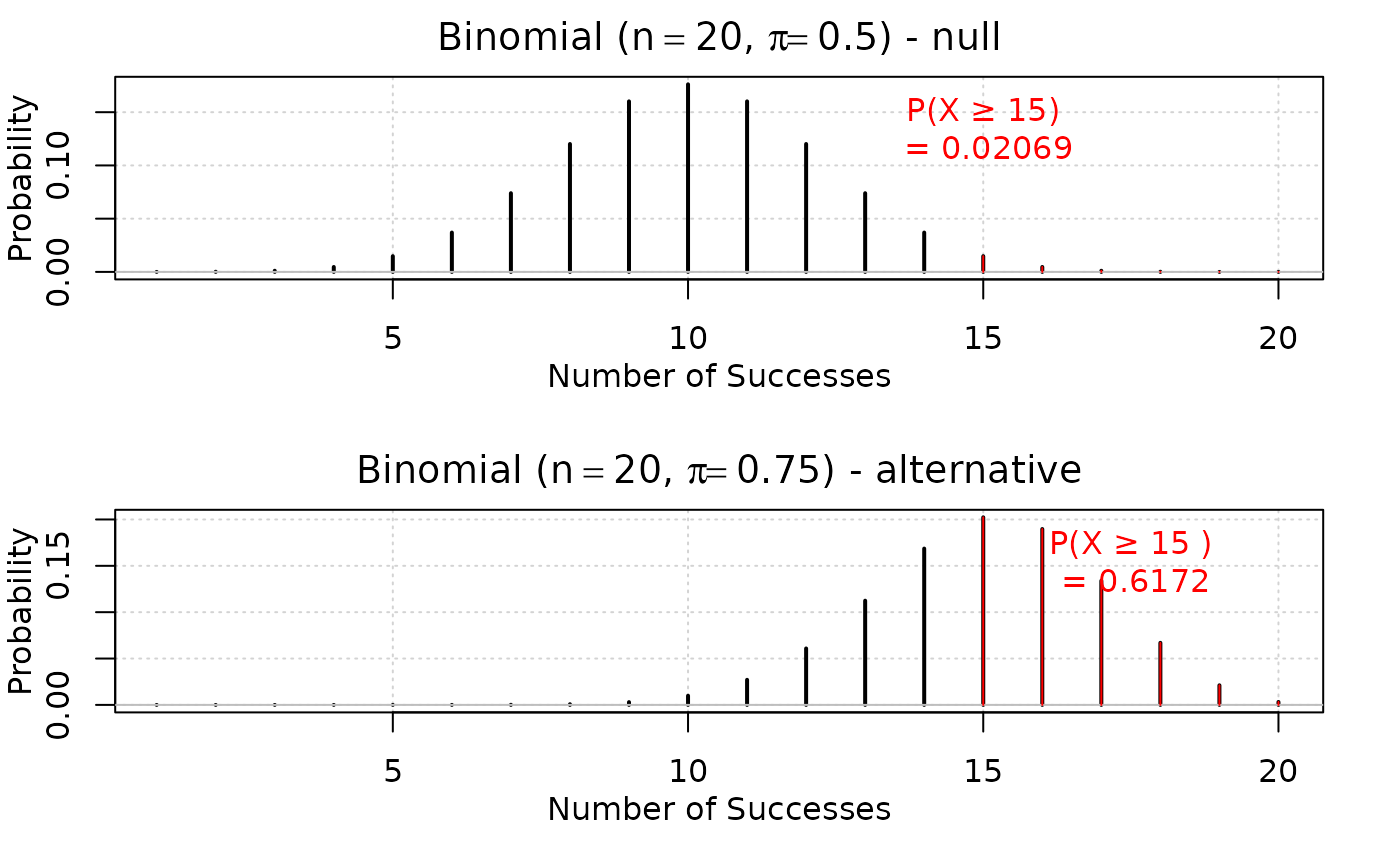 #> Alternative: Probability 15 and above = 0.6171727
iscambinompower(LOS = 0.10, n = 30, prob1 = 0.4, alternative = "two.sided")
#> Alternative: Probability 15 and above = 0.6171727
iscambinompower(LOS = 0.10, n = 30, prob1 = 0.4, alternative = "two.sided")
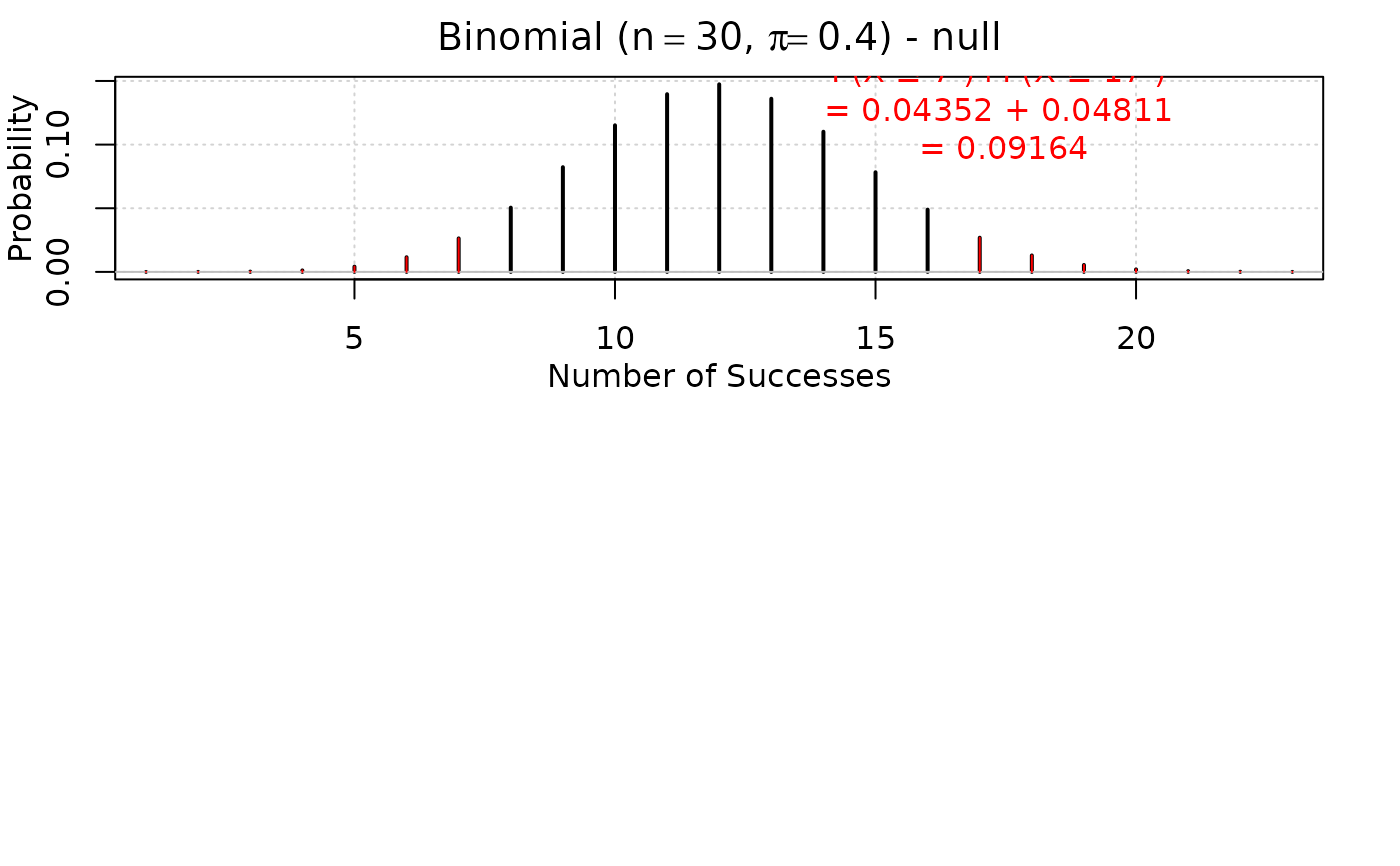 #> Null: Probability in rejection region 0.09164
iscambinompower(LOS = 0.10, n = 30, prob1 = 0.4, alternative = "two.sided", prob2 = 0.2)
#> Null: Probability in rejection region 0.09164
#> Null: Probability in rejection region 0.09164
iscambinompower(LOS = 0.10, n = 30, prob1 = 0.4, alternative = "two.sided", prob2 = 0.2)
#> Null: Probability in rejection region 0.09164
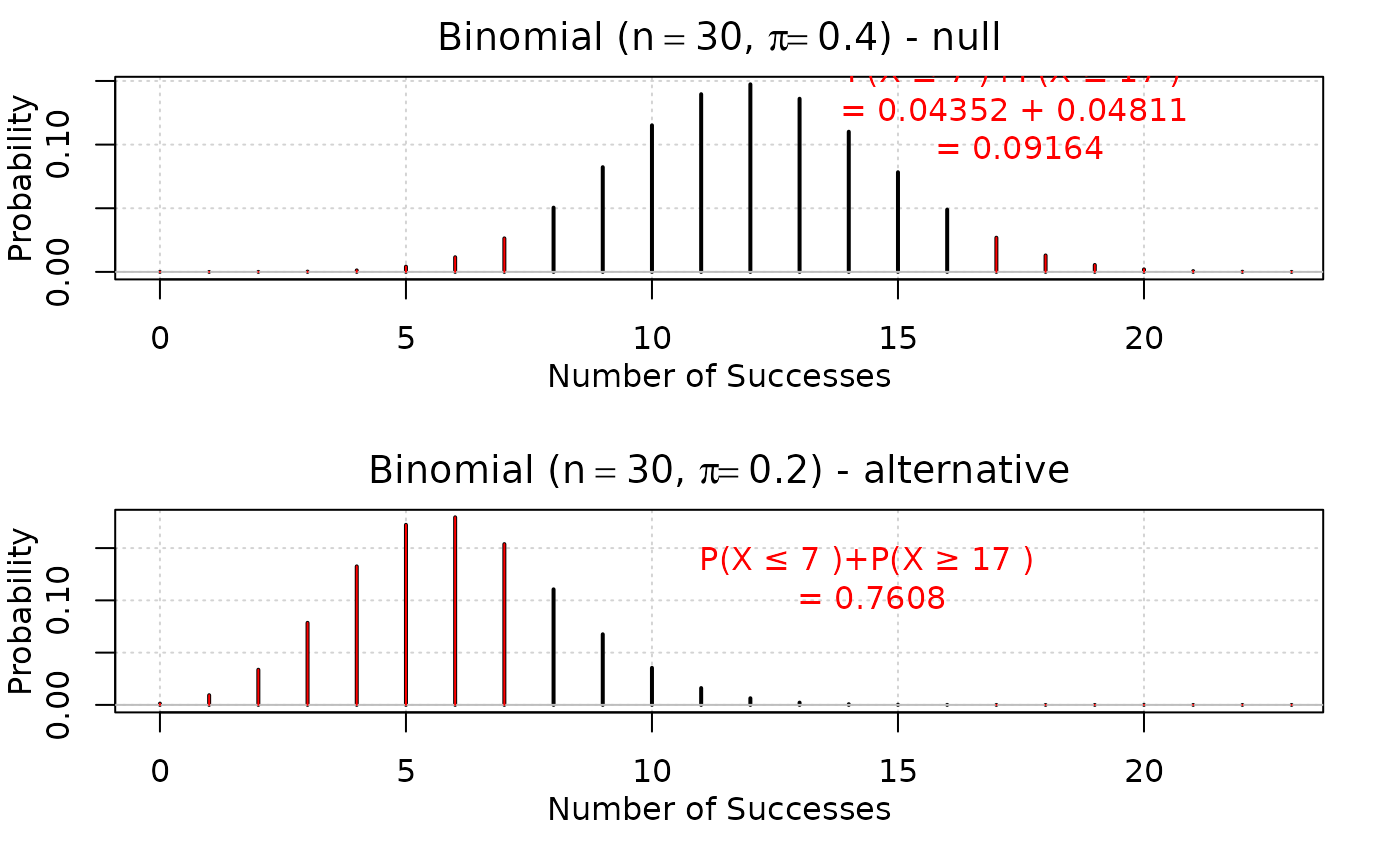 #> Alternative: Probability in rejection region 0.7608011