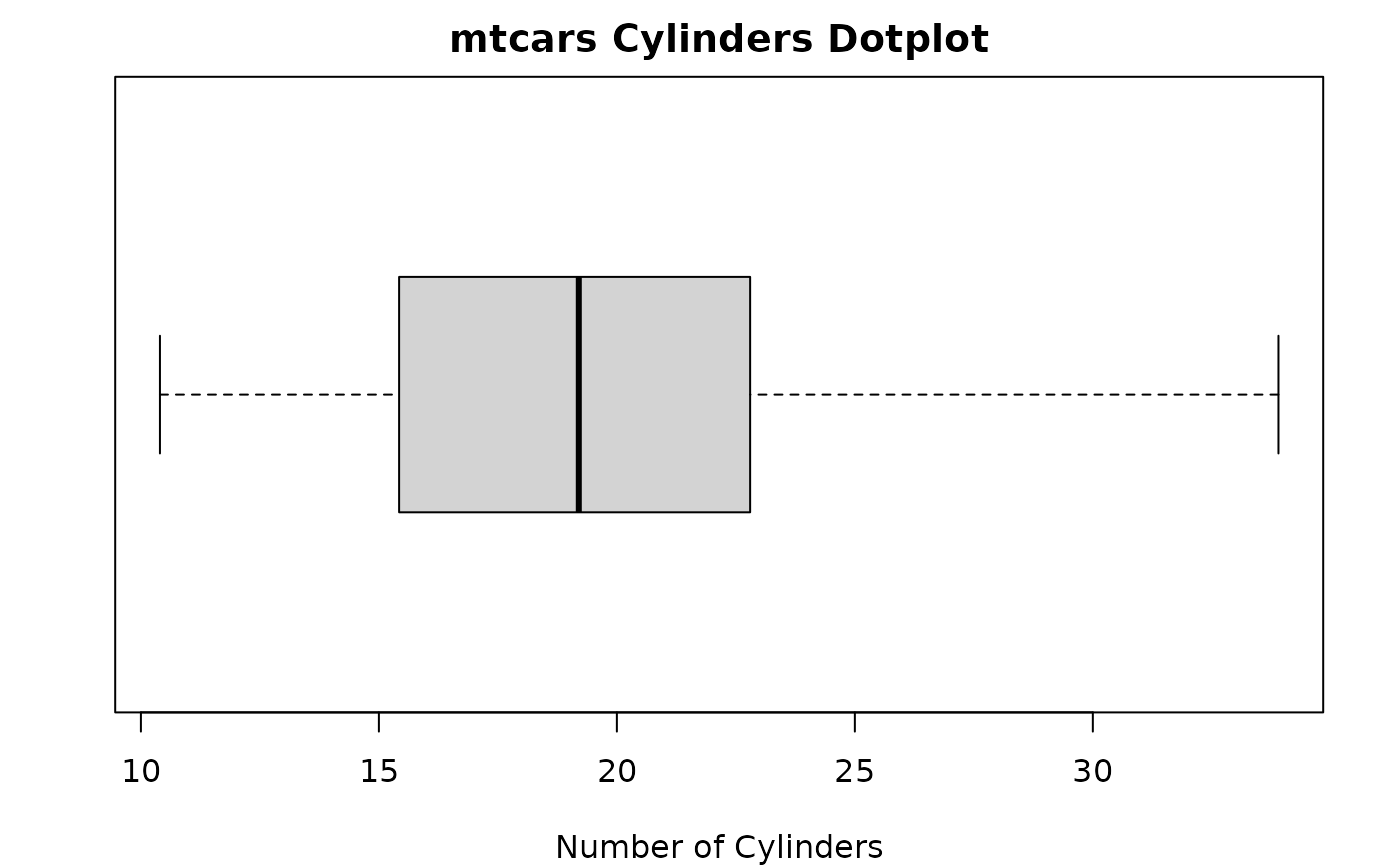
boxplot plots the given data in a box plot. If a second categorical variable
is given, the data is grouped by this variable.
Usage
iscamboxplot(
  response,
  explanatory = NULL,
  main = "",
  xlab = "",
  ylab = substitute(explanatory)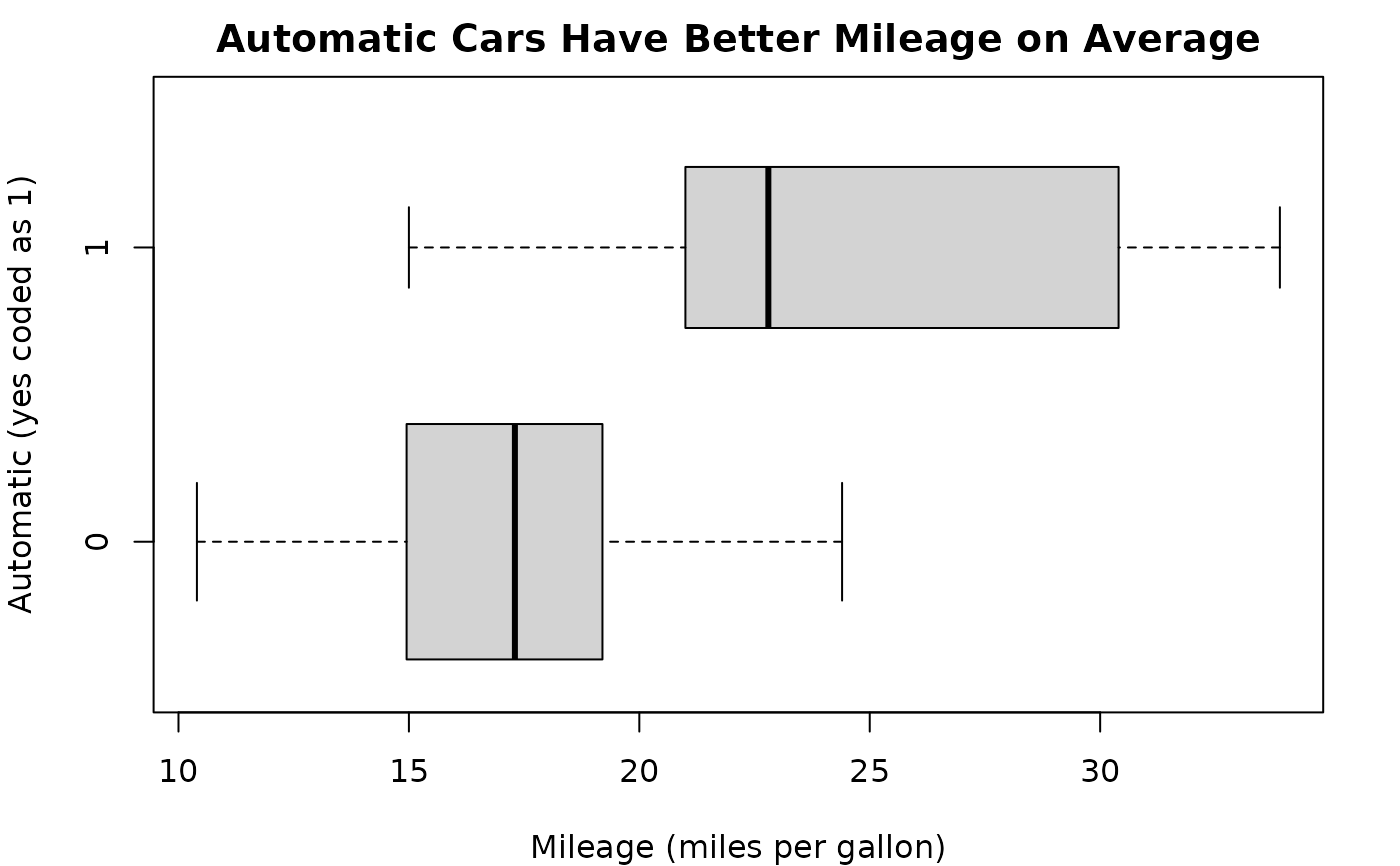
)boxplot plots the given data in a box plot. If a second categorical variable
is given, the data is grouped by this variable.
iscamboxplot(
response,
explanatory = NULL,
main = "",
xlab = "",
ylab = substitute(explanatory)
)