normpower determines the rejection region corresponding to the level of
significance and the first probability and shows the normal distribution
shading its corresponding region.
Arguments
- LOS
A numeric value representing the level of significance; 0 <
LOS< 1- n
A numeric value representing the sample size
- prob1
A numeric value representing the first probability
- alternative
"less", "greater", or "two.sided"
- prob2
A numeric value representing the second probability
- verbose
Logical, defaults to
TRUE. Set toFALSEto suppress messages
Examples
iscamnormpower(0.05, n = 100, prob1 = 0.5, alternative = "greater", prob2 = 0.6)
#> Null: Probability 0.5822 and above = 0.05
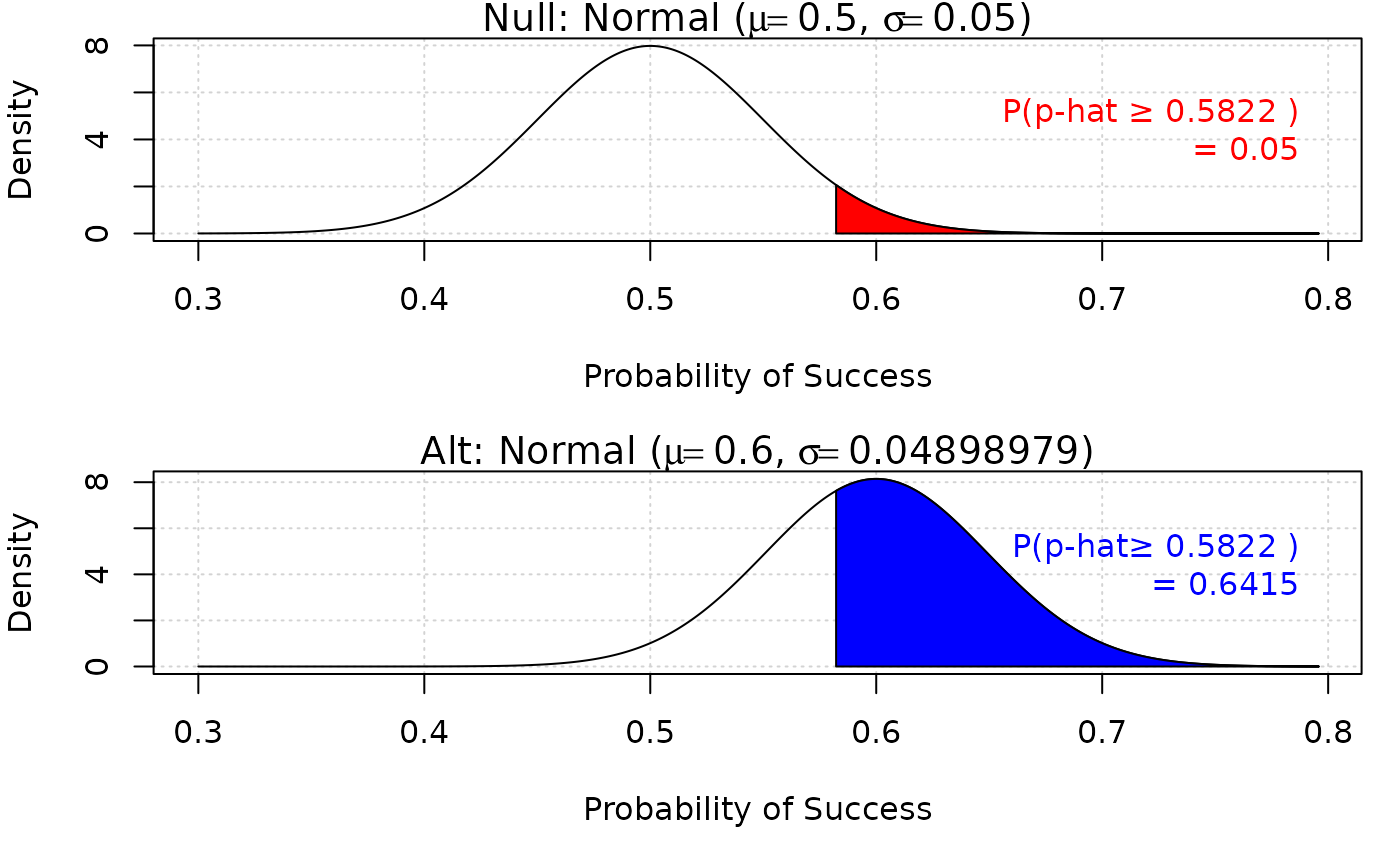 #> Alt: Probability 0.5822 and above = 0.6414995
iscamnormpower(0.10, n = 50, prob1 = 0.25, alternative = "less", prob2 = 0.15)
#> Null: Probability 0.1715 and below = 0.1
#> Alt: Probability 0.5822 and above = 0.6414995
iscamnormpower(0.10, n = 50, prob1 = 0.25, alternative = "less", prob2 = 0.15)
#> Null: Probability 0.1715 and below = 0.1
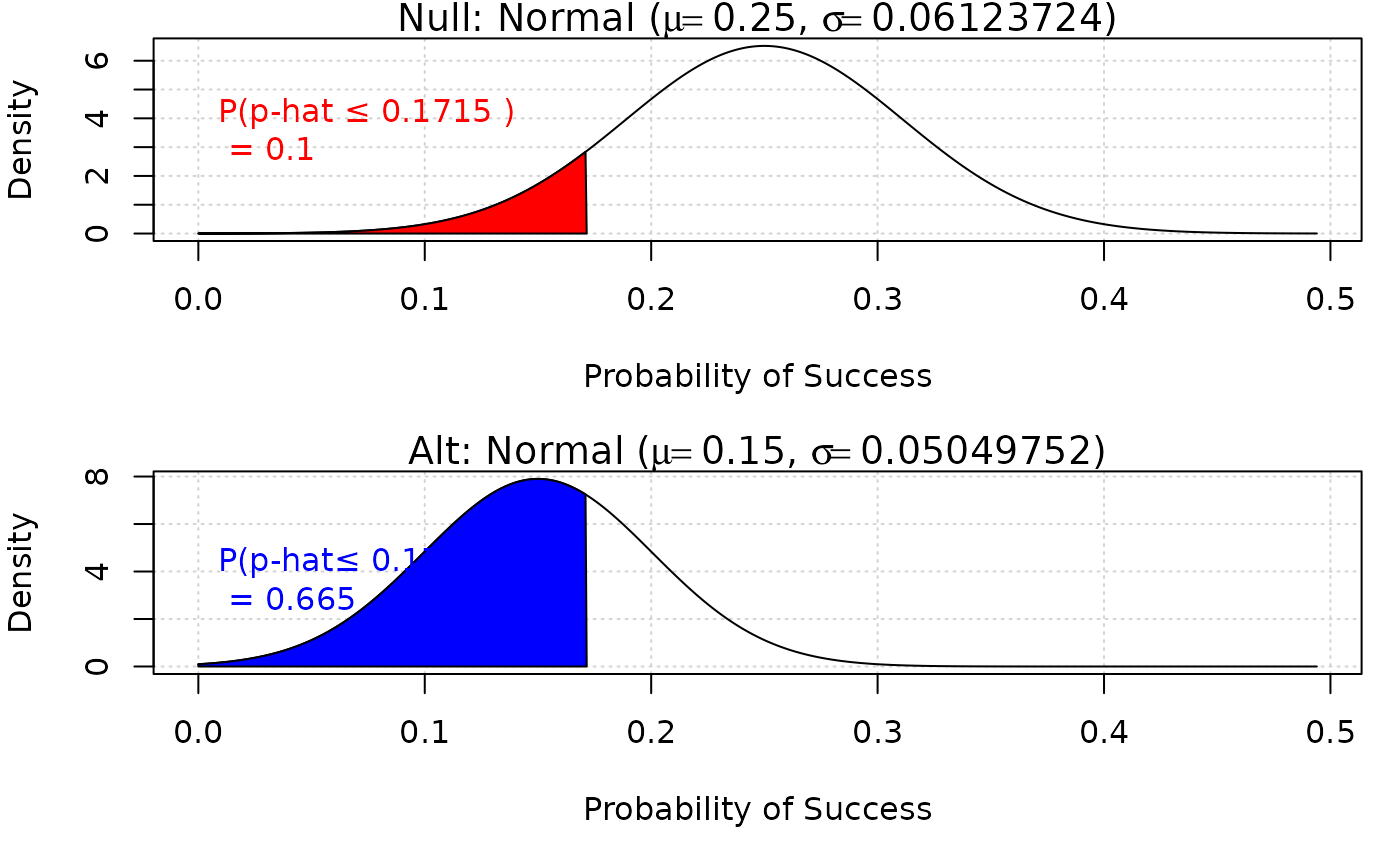 #> Alt: Probability 0.1715 and below = 0.6650137
iscamnormpower(0.05, n = 200, prob1 = 0.8, alternative = "two.sided", prob2 = 0.7)
#> Null: Probability in rejection region 0.05
#> Alt: Probability 0.1715 and below = 0.6650137
iscamnormpower(0.05, n = 200, prob1 = 0.8, alternative = "two.sided", prob2 = 0.7)
#> Null: Probability in rejection region 0.05
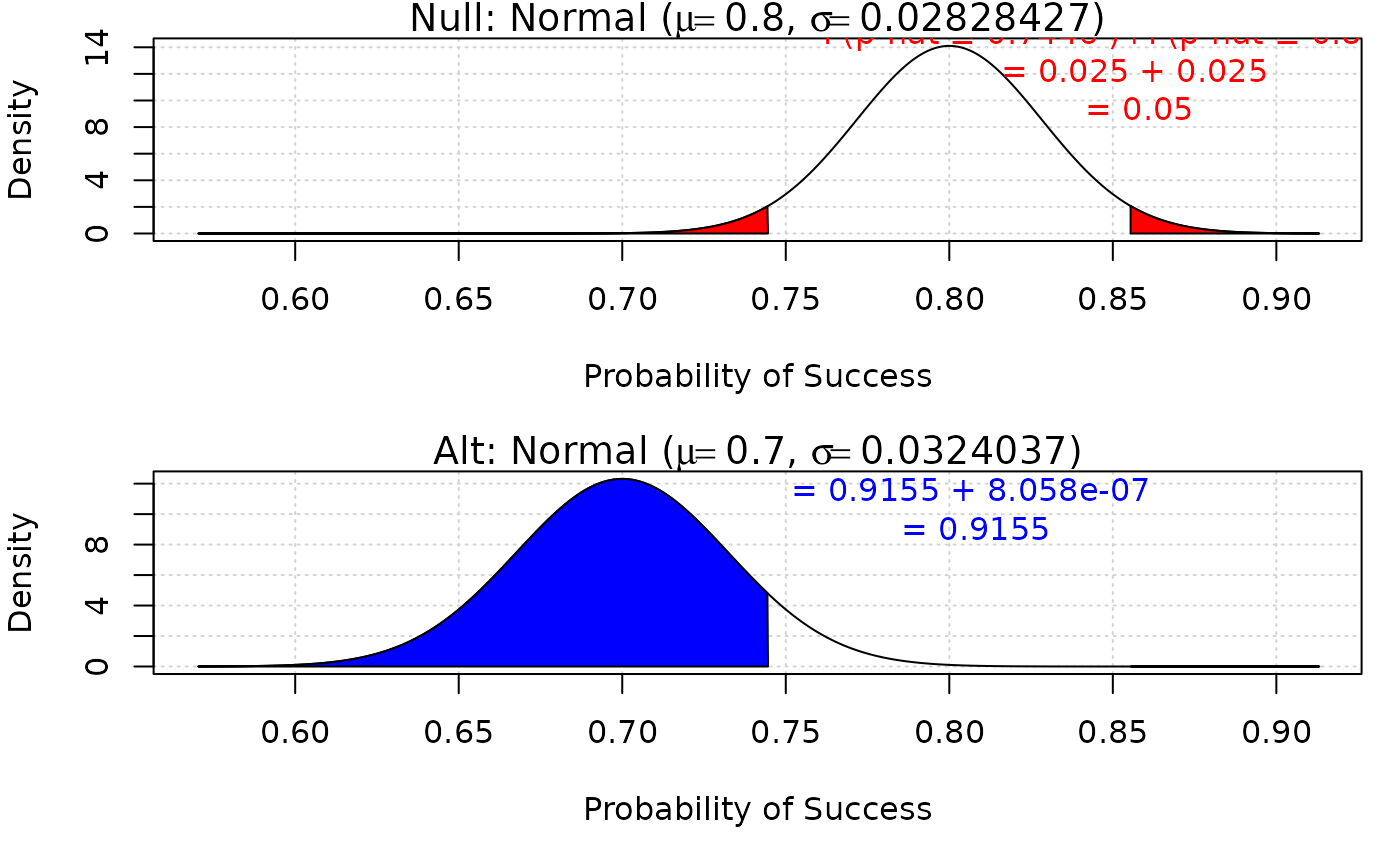 #> Alt: Probability in rejection region 0.9155